Monitoring and Maintaining the Environment
Monitoring Ecosystems
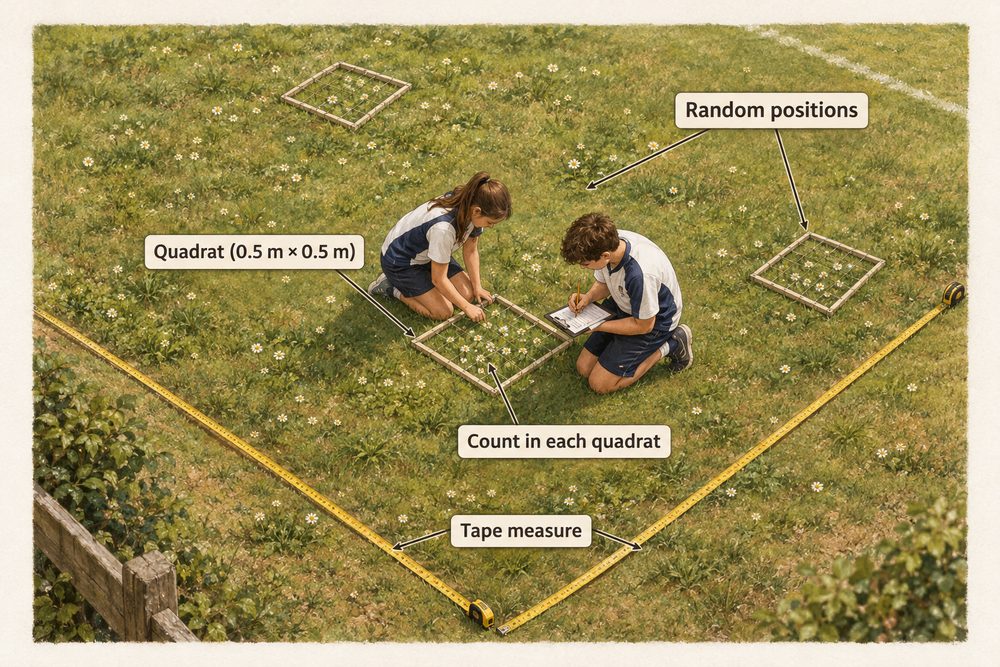
To understand the health of an ecosystem, scientists monitor the distribution and abundance of organisms (B6.1a). Field investigations use a range of sampling techniques to estimate population sizes without counting every individual.
Random sampling uses quadrats placed at random coordinates to avoid bias. Transect sampling places quadrats along a line to measure how distribution changes across a habitat (e.g. from woodland to open field). The capture-recapture method estimates animal populations: a sample is caught, marked, released, then a second sample is caught and the proportion of marked individuals is used to estimate total population size using the formula:
$$\text{Estimated population} = \frac{\text{number in 1st sample} \times \text{number in 2nd sample}}{\text{number marked in 2nd sample}}$$
Other equipment includes pooters (for small invertebrates), sweep nets, pitfall traps and identification keys.
The reliability of sampling depends on sample size and method. Random sampling avoids bias because the researcher does not choose where to place quadrats. In transect sampling, the regular spacing provides systematic data about how abiotic conditions (such as light or soil moisture) change across a habitat, and how this affects species distribution.
For capture-recapture to work accurately, several assumptions must hold: the marked individuals must have time to mix back into the population, marking must not affect survival or behaviour, and the population size must remain stable (no births, deaths, immigration or emigration) between samples. If these assumptions are violated, the estimate will be unreliable.
Another key technique is using quadrat grids with percentage cover estimates, where the researcher records what percentage of each quadrat is covered by a particular species. This is useful for plants and slow-moving organisms and gives more detail than simple presence/absence recording.
Environmental DNA (eDNA) is an emerging technique where scientists collect water or soil samples and analyse traces of DNA left behind by organisms. This allows them to detect the presence of elusive species without directly observing them — a non-invasive approach to monitoring biodiversity.
One serious effect of water pollution is eutrophication. When excess nitrate or phosphate fertilisers wash into rivers and lakes, they stimulate rapid algal growth (algal bloom). The dense algae block sunlight, killing aquatic plants below the surface. When the algae die, decomposing bacteria multiply and consume dissolved oxygen. Oxygen levels fall so low that fish and other aerobic organisms suffocate. This sequence — nutrient enrichment, algal bloom, light blocking, decomposition, oxygen depletion — is a common exam question.
Conservation scientists use long-term monitoring data to track trends: is biodiversity increasing or decreasing? Are conservation measures working? Citizen science projects, where members of the public record sightings of species (e.g. the RSPB Big Garden Birdwatch), contribute millions of data points that scientists alone could never collect. This large-scale data helps identify declining species and target conservation efforts where they are needed most.
Sampling techniques include random quadrats (for plants), transects (to show change across a habitat) and capture-recapture (for mobile animals). Results are scaled up to estimate total population size (B6.1a).
Human Interactions with Ecosystems
Humans interact with ecosystems in both positive and negative ways (B6.1b). Negative impacts include:
• Deforestation — removes habitats, reduces biodiversity and releases stored carbon.
• Pollution — air pollution from burning fossil fuels (SO\(_2\), NO\(_x\)) causes acid rain; water pollution from fertiliser run-off causes eutrophication.
• Over-exploitation — overfishing and over-hunting reduce populations faster than they can recover.
• Introduction of invasive species — non-native species outcompete native organisms for resources.
Indicator species reveal pollution levels without expensive equipment (B6.1b). Lichens are indicators of air quality — bushy lichens grow only in clean air, while crusty lichens tolerate pollution. Freshwater invertebrates indicate water quality: stonefly larvae and freshwater shrimp need clean, oxygen-rich water; bloodworms and rat-tailed maggots tolerate polluted, low-oxygen water.
Scientists also use direct measurements: dissolved oxygen meters, pH probes and turbidity tubes provide quantitative data that can be compared over time or between sites. Combining biological and physical indicators gives a more complete picture of ecosystem health.
Indicator species show pollution levels: lichens for air quality, freshwater invertebrates for water quality. Their presence or absence provides evidence of environmental conditions.
Sustainability means using resources in a way that meets current needs without compromising future generations (B6.1c). Conservation strategies include:
• Protected areas — national parks and nature reserves limit human activity.
• Breeding programmes — captive breeding of endangered species with planned reintroduction to the wild.
• Seed banks — storing seeds from rare plant species as a safeguard against extinction.
• Fishing quotas and logging regulations — controlling how much is taken from ecosystems.
• Reforestation — planting trees to restore habitats and absorb CO\(_2\).
Effective conservation requires scientific monitoring to measure whether strategies are working, and cooperation between governments, scientists and local communities.
Sustainability means meeting present needs without harming future generations. Conservation uses protected areas, breeding programmes, seed banks, quotas and reforestation to maintain biodiversity.